

Overview
Alpic Analytics gives you a complete picture of how your plugin is used: how many sessions and users you have, which tools are called, how fast they respond, and where errors happen. There is nothing to install. Alpic sits in front of your MCP server and records every MCP request as it passes through: the method called, the MCP client, the response time, the outcome, and the user identity when one is available. Your code stays untouched and no SDK is required.Analytics are collected separately for each environment. The dashboard defaults to your production environment; use
the environment picker to switch.
Key indicators
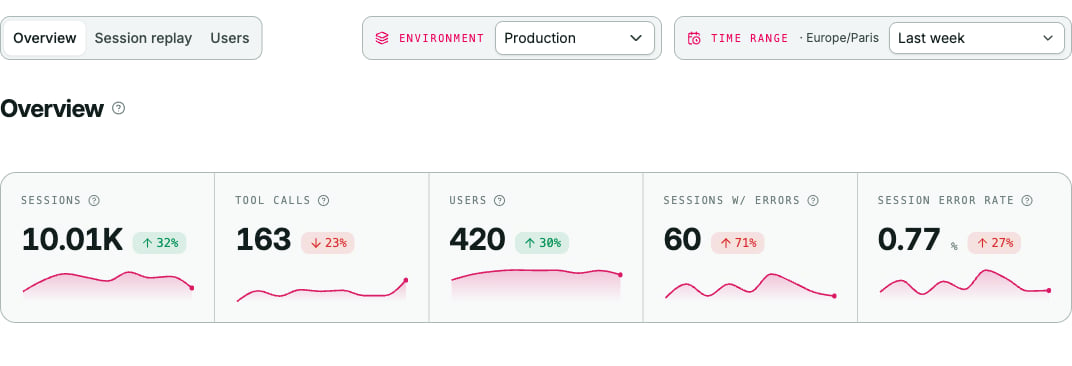
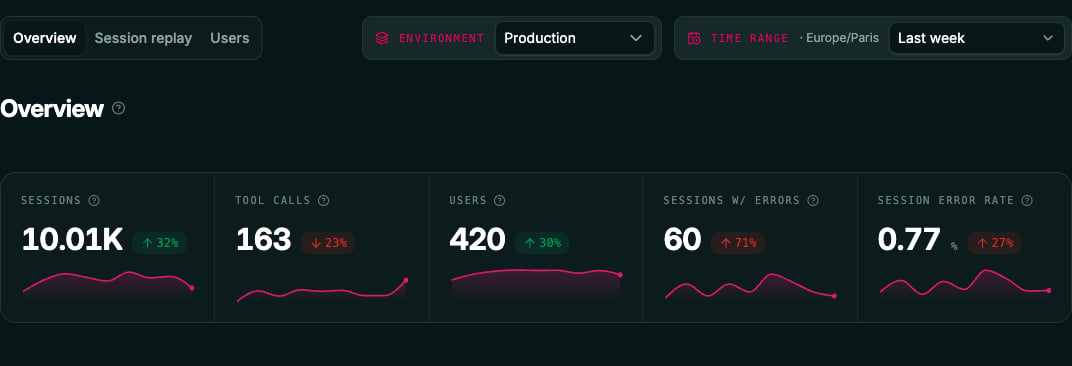
- Sessions: how many sessions were active, one per conversation when the client provides one
- Tool calls: how many
tools/callrequests users, agents and an LLM intentionally invoked - Users: how many distinct identified people used your server
- Sessions with errors: how many sessions contained at least one error
- Session error rate: the share of sessions that contained an error
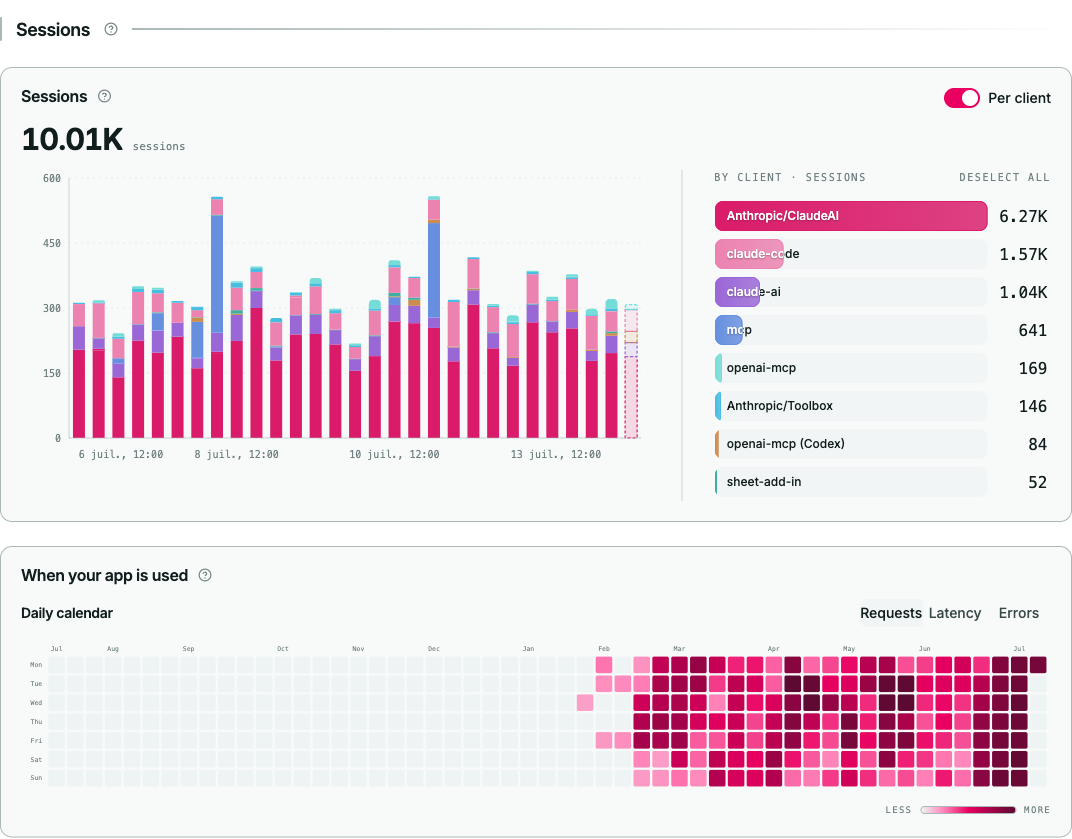
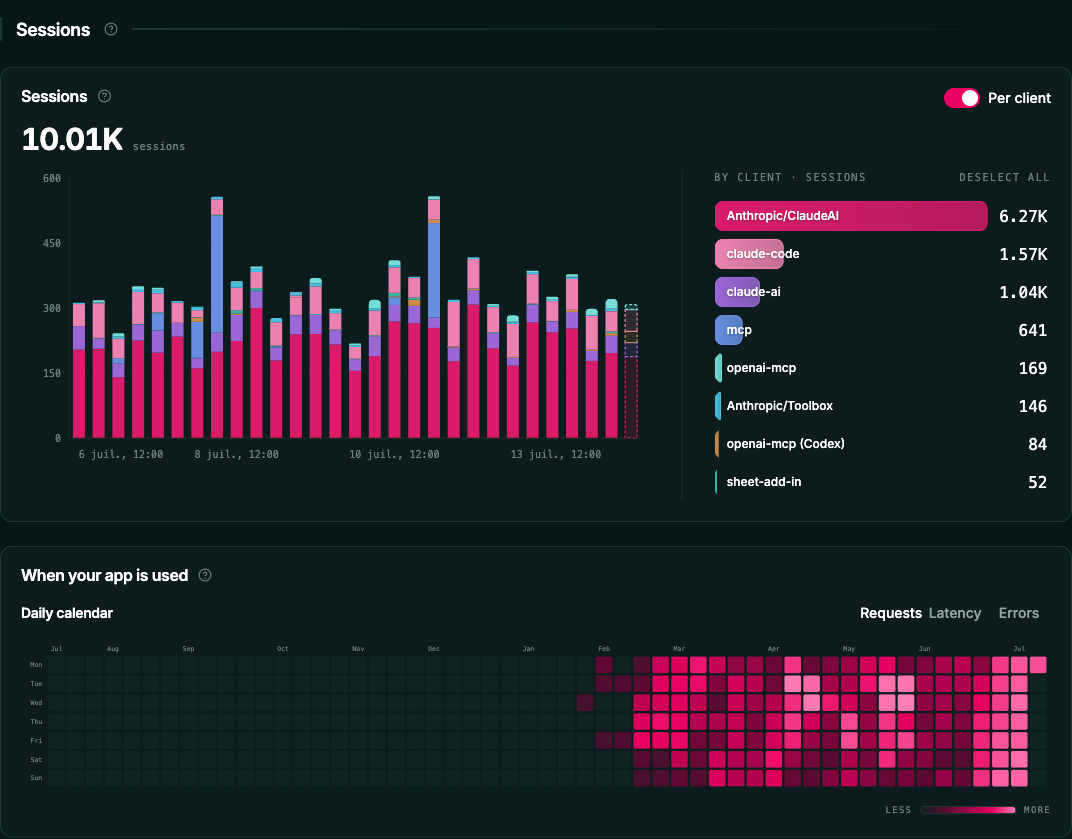
Sessions
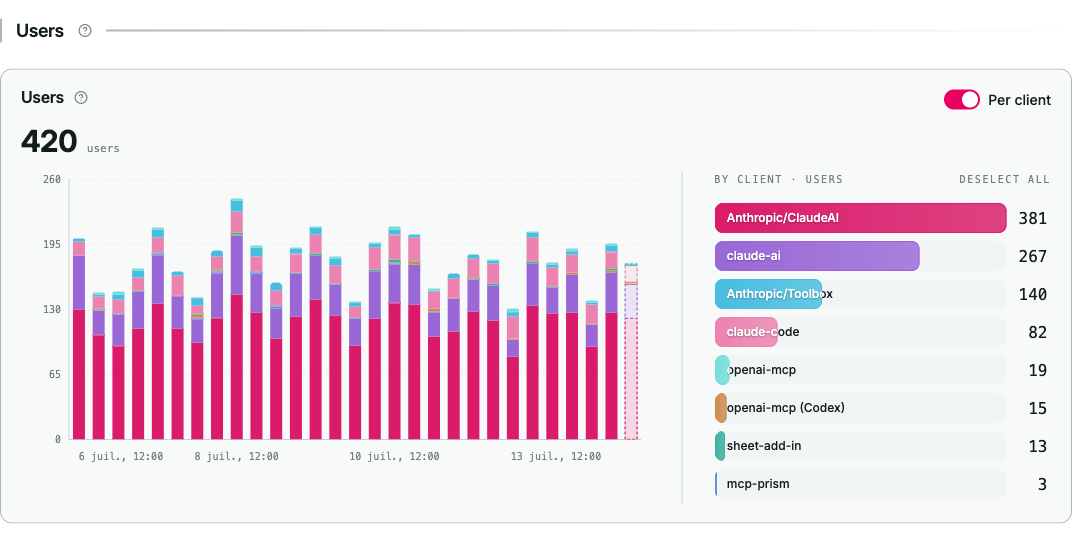
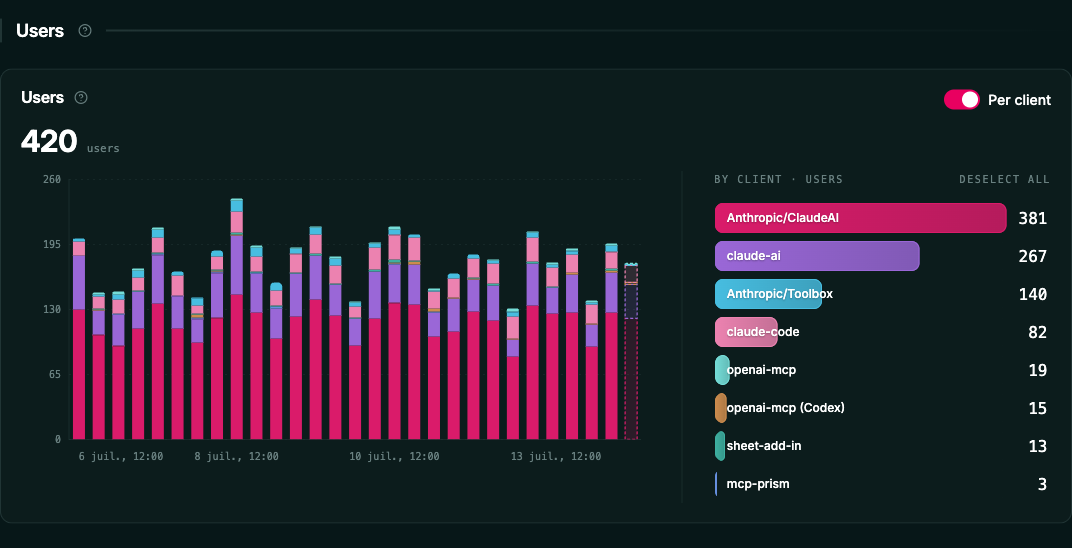
Users
Tools
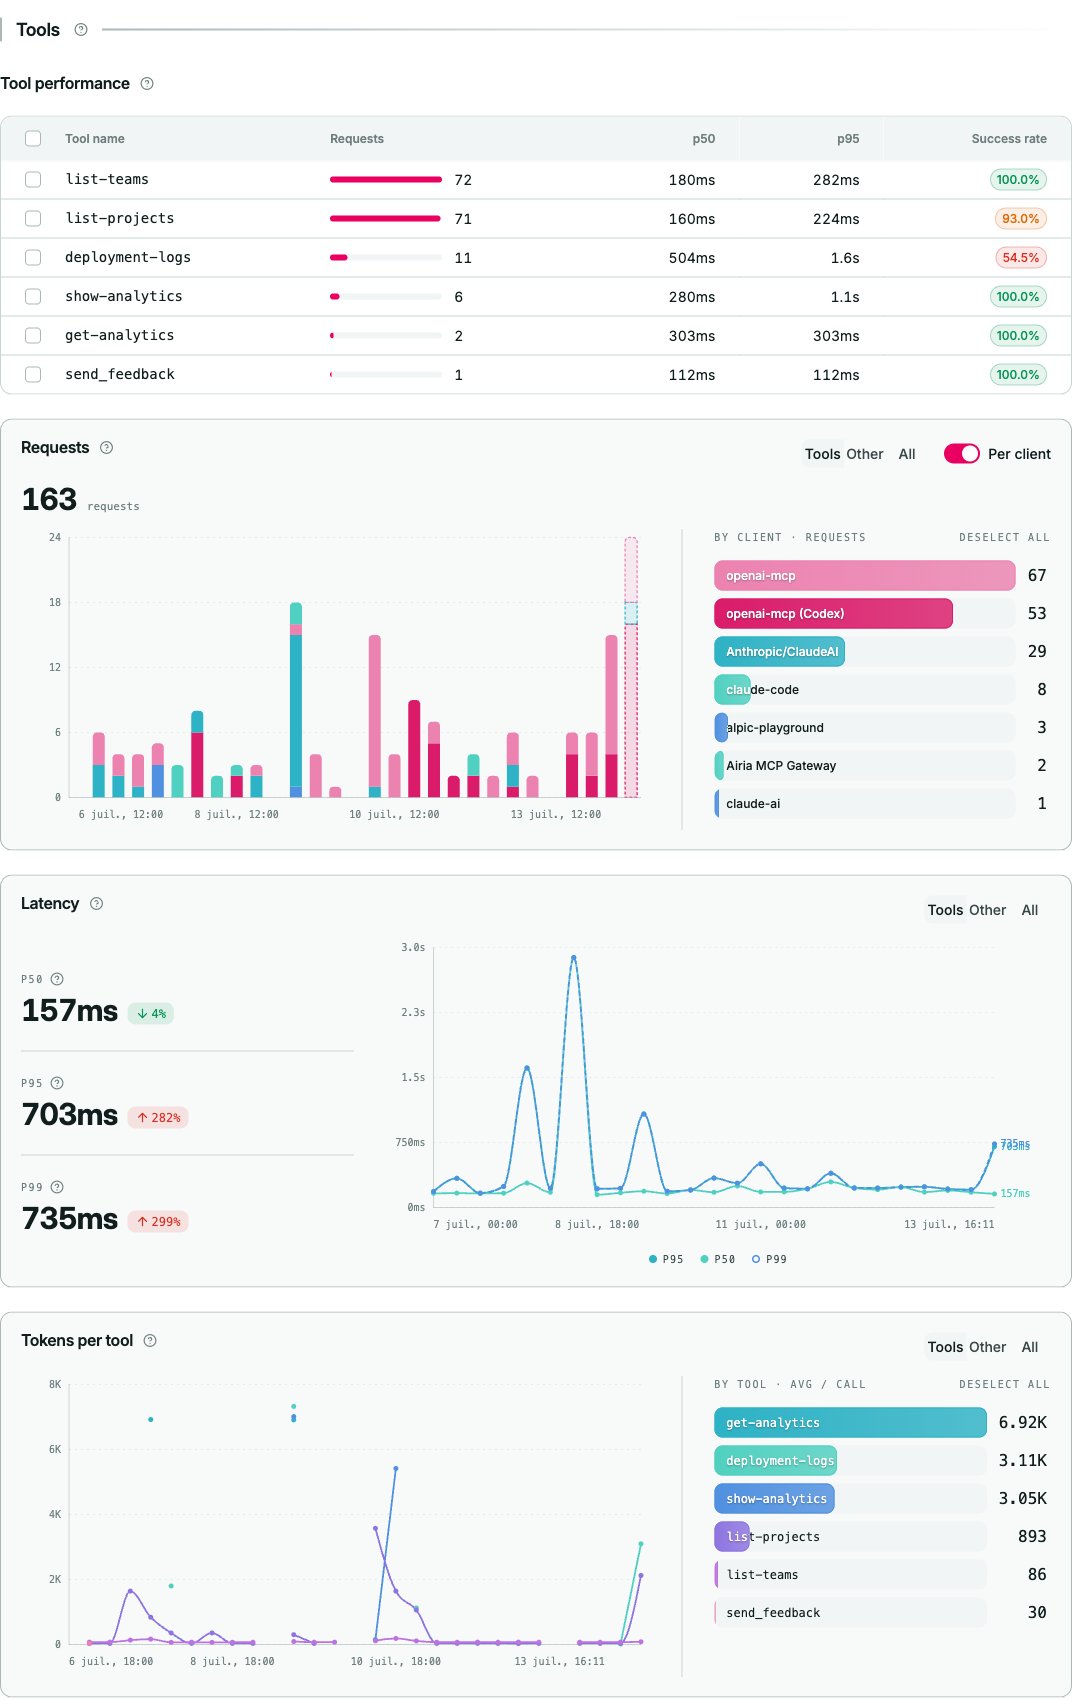
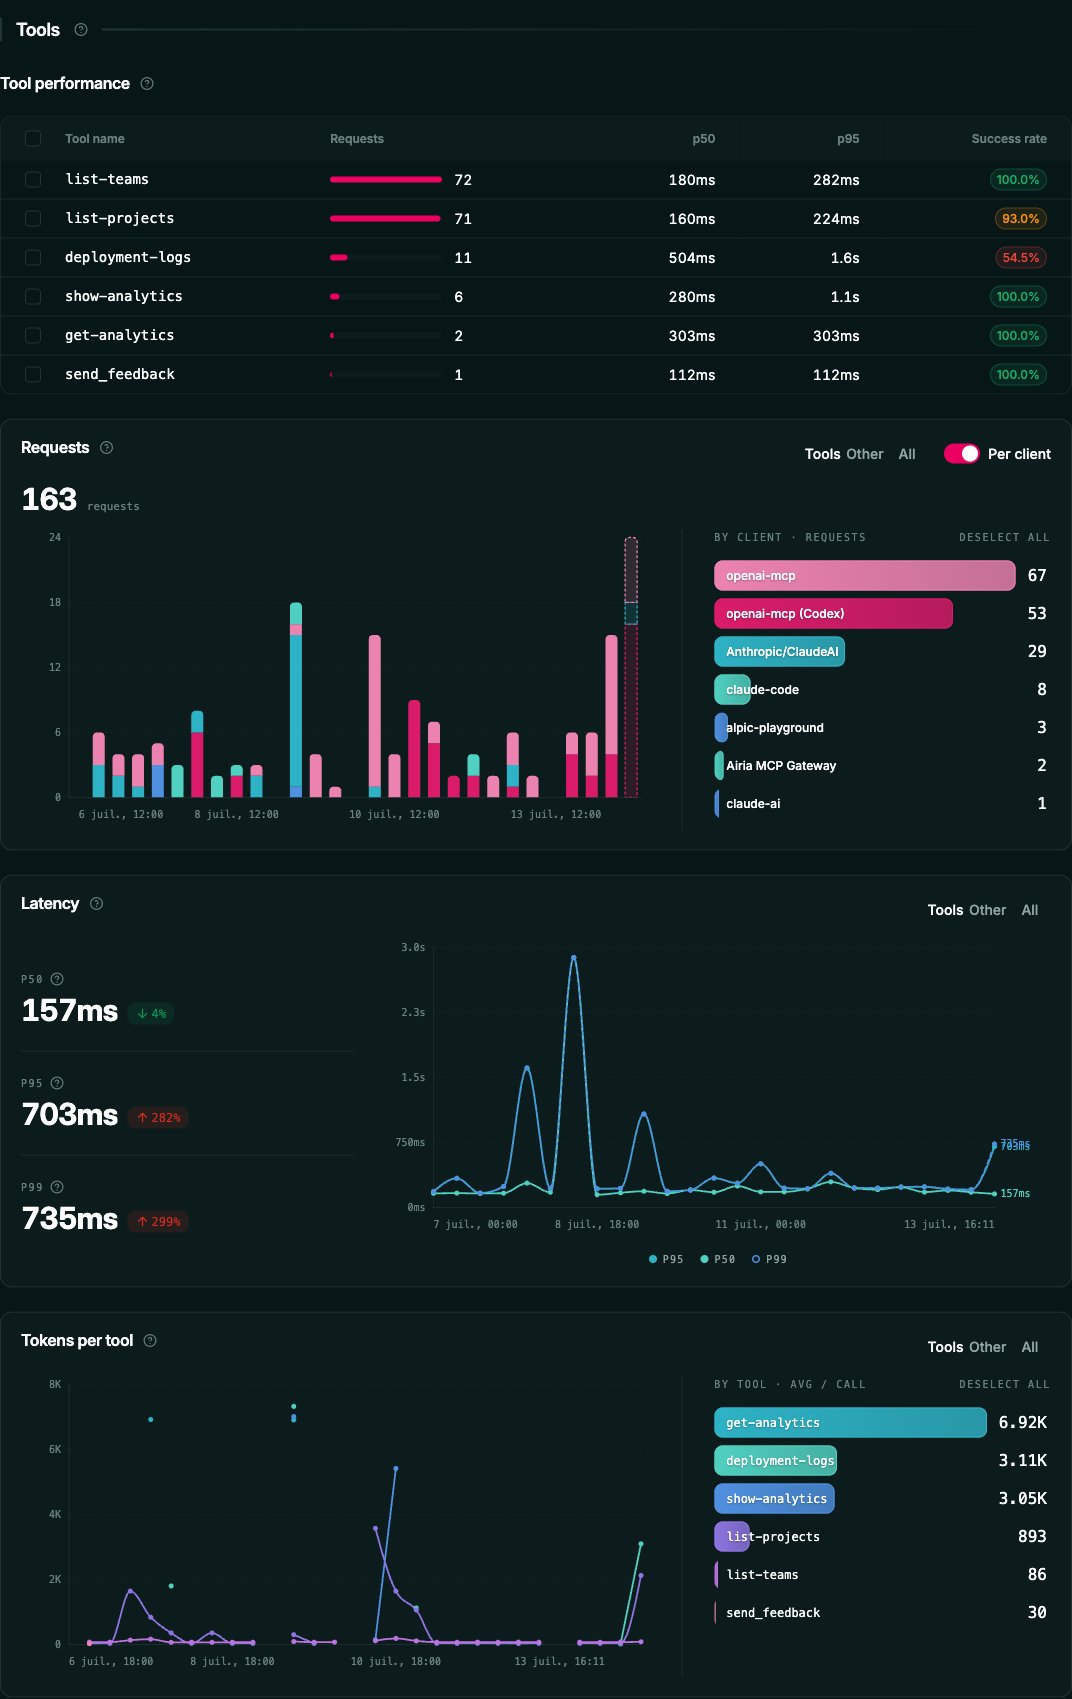
- Requests over time
- Latency over time (p50, p95, p99)
- Tokens per call
initialize requests).
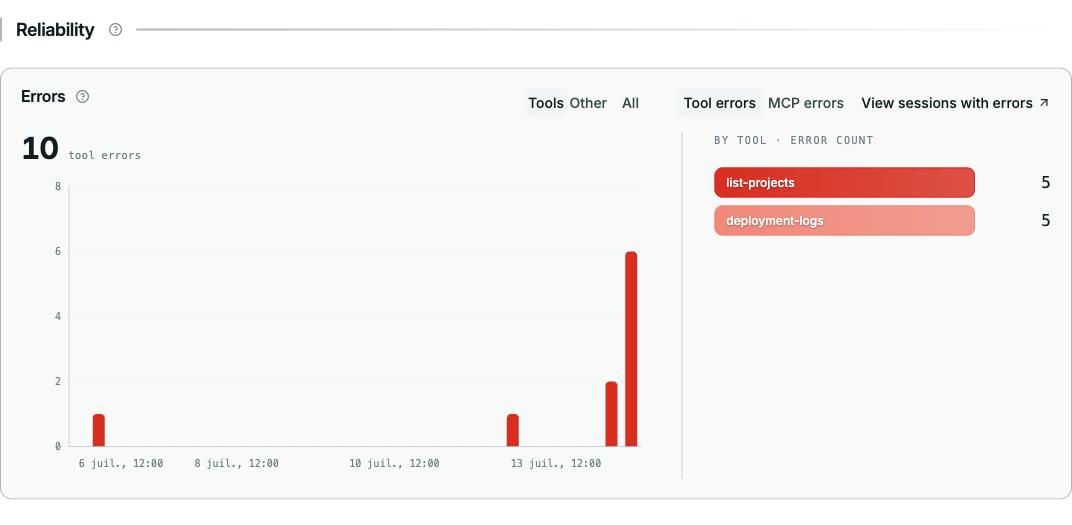
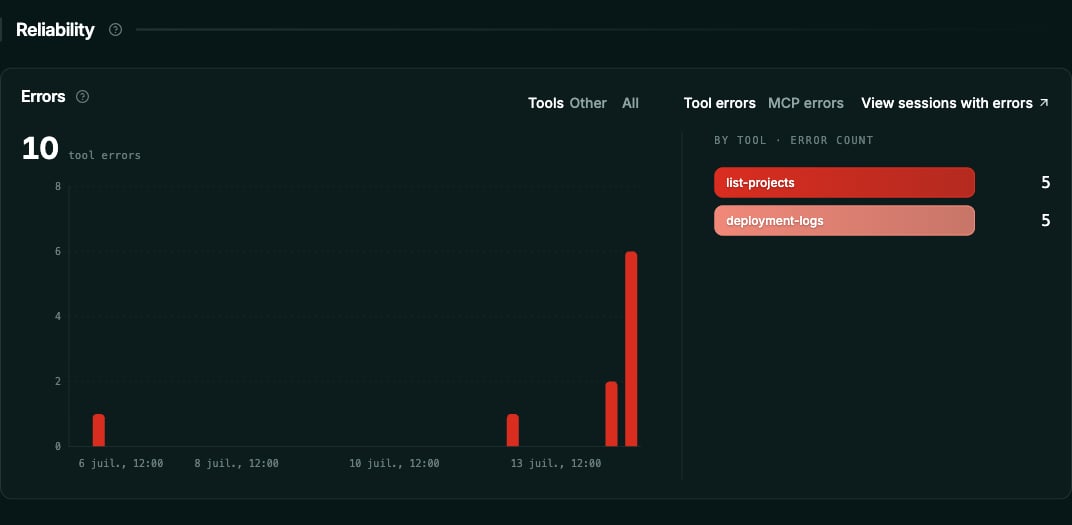
Reliability
Time ranges and granularity
You can view analytics over the last day, week, month, or year, or pick a custom date range. Chart granularity adjusts automatically to the range you select, from 5 minute buckets on short ranges up to daily buckets on long ones. How far back you can look depends on your plan’s analytics retention, from 7 days on the Free plan to unlimited on Enterprise. Time ranges beyond your retention appear locked in the picker. See Plans for details.Go further
Metric definitions
Exactly what each metric measures
How users are counted
Identity sources and unique user counting
Privacy & Data Collection
Control what data is collected